
XAUUSD H1: Double top and neckline breakout technical pattern
2 weeks agoThe XAUUSD chart shows signs of weakness in the upward movement as the price fails to overcome the resistance level.
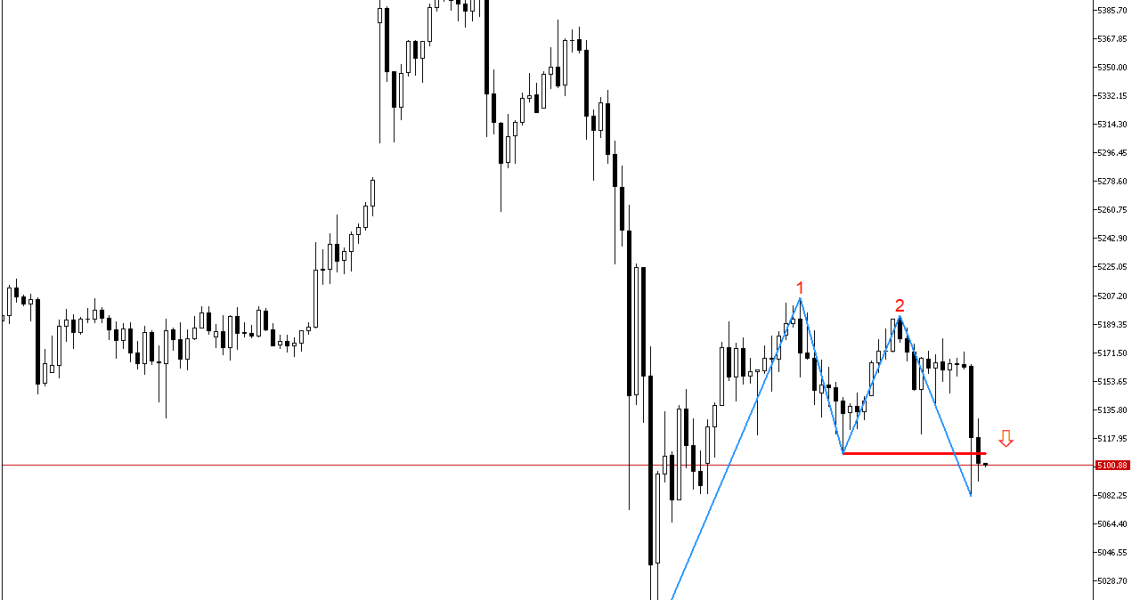
The formation of a classic Double Top reversal pattern is observed on the chart. The main signal for confirmation of the pattern is the breakthrough of the neckline, which was drawn through the minimum between the two peaks at the level 5108.53. Now the price has broken through this line, which confirms the reversal nature of the pattern.
Thus, in terms of XAUUSD, preference should be given to short positions. A trader can enter the market at or around the current prices or when the resistance level is retested.
📌 Entry: 5102.13
✔️ First target: 4991.48
✔️ Second target: 4913.45
❌ Stop order: 5206.07